How to Speed Up a Website

Infrastructure Editor
Disclosure: Some links on this page are affiliate links — if you sign up through one, we may earn a commission at no extra cost to you. It never changes our ratings, rankings or verdicts: we don't sell hosting and take no pay-for-placement.
Who it's for
- Website owners
- Developers optimising for Core Web Vitals
- E-commerce site owners
- SEO practitioners
By Marcus Feld, Infrastructure Editor
Why Website Speed Is a Stack, Not a Single Fix
“My website is slow” almost never has one cause. Speed is the sum of five layers stacked on top of each other. First, how fast the server responds to the first request. Second, whether that response gets cached for the next visitor. Third, how efficiently images and scripts get delivered. Fourth, how fast the database returns data the page needs. Fifth, as a downstream measurement of all of that, how the page scores on Core Web Vitals. Fixing one layer while ignoring the others produces a smaller improvement than expected. That’s why so many “we optimized our images and it’s still slow” complaints exist.
This guide walks through all five layers with concrete metric targets for each. It also covers which fixes belong to hosting and which belong to the application layer. If your speed problem shows up as a single symptom rather than general sluggishness, why is my website slow has a faster diagnostic path.
Layer 1: Server Response Time (TTFB)
Time to First Byte measures how long the server takes to start sending a response after a request arrives. This is the foundation. No amount of front-end optimization compensates for a server that takes a second and a half just to begin responding.
Target: under 200ms for a well-optimized dynamic site; under 100ms is achievable for static or heavily cached content.
Hosting-side fix: upgrade to hosting with adequate CPU/RAM headroom for the workload. Enable server-level caching (OPcache for PHP), and choose a server location close to the majority of visitors.
App-side fix: reduce database queries per page load and eliminate unnecessary external API calls that block the response.
The full breakdown of this specific layer lives at reduce server response time (TTFB).
Layer 2: Caching
Caching stores a pre-built version of a page or asset, so the server doesn’t have to regenerate it from scratch for every visitor. This is usually the single biggest speed win available. It removes repeated work entirely, rather than just making that work faster.
Target: cache hit ratio above 90% for a mostly-static or infrequently-updated site.
Hosting-side fix: enable server-level page caching (many managed hosts include this by default) and add a CDN to cache static assets at edge locations close to visitors.
App-side fix: configure browser caching headers correctly and use object caching (like Redis or Memcached) for database query results on dynamic sites.
Full detail at website caching explained.
Layer 3: Asset Delivery and Compression
Images, CSS, and JavaScript files that are too large or delivered inefficiently add real, measurable load time. This happens independent of how fast the server itself responds.
Target: total page weight under 2MB for a typical content page; images compressed to modern formats (WebP/AVIF) at appropriate dimensions.
Hosting-side fix: a CDN reduces the physical distance data travels — see server location and speed for how geography factors in here.
App-side fix: compress and resize images before upload, minify CSS/JS, and defer non-critical scripts so they don’t block page rendering.
Layer 4: Database Efficiency
For any dynamic site — WordPress, an ecommerce platform, a custom application — the database is frequently the actual bottleneck. It often hides behind a “slow server” diagnosis.

Target: individual query execution time under 50ms; no more than a handful of database queries per page load on a well-optimized site.
Hosting-side fix: ensure the database has adequate memory allocation and runs on SSD/NVMe storage — see hosting storage: SSD vs NVMe.
App-side fix: add indexes to frequently-queried columns, eliminate redundant queries, and clean up unused data (old revisions, spam comments, expired sessions).
Full detail at database optimization for websites.
Layer 5: Core Web Vitals
Core Web Vitals translate everything above into the specific metrics Google measures directly. These are Largest Contentful Paint (LCP), Interaction to Next Paint (INP), and Cumulative Layout Shift (CLS). These aren’t separate problems to solve — they’re the downstream result of the first four layers being handled correctly.
Targets: LCP under 2.5 seconds, INP under 200ms, CLS under 0.1.
Full detail on how hosting choices specifically affect these three metrics at hosting and Core Web Vitals.
Measurement Tools
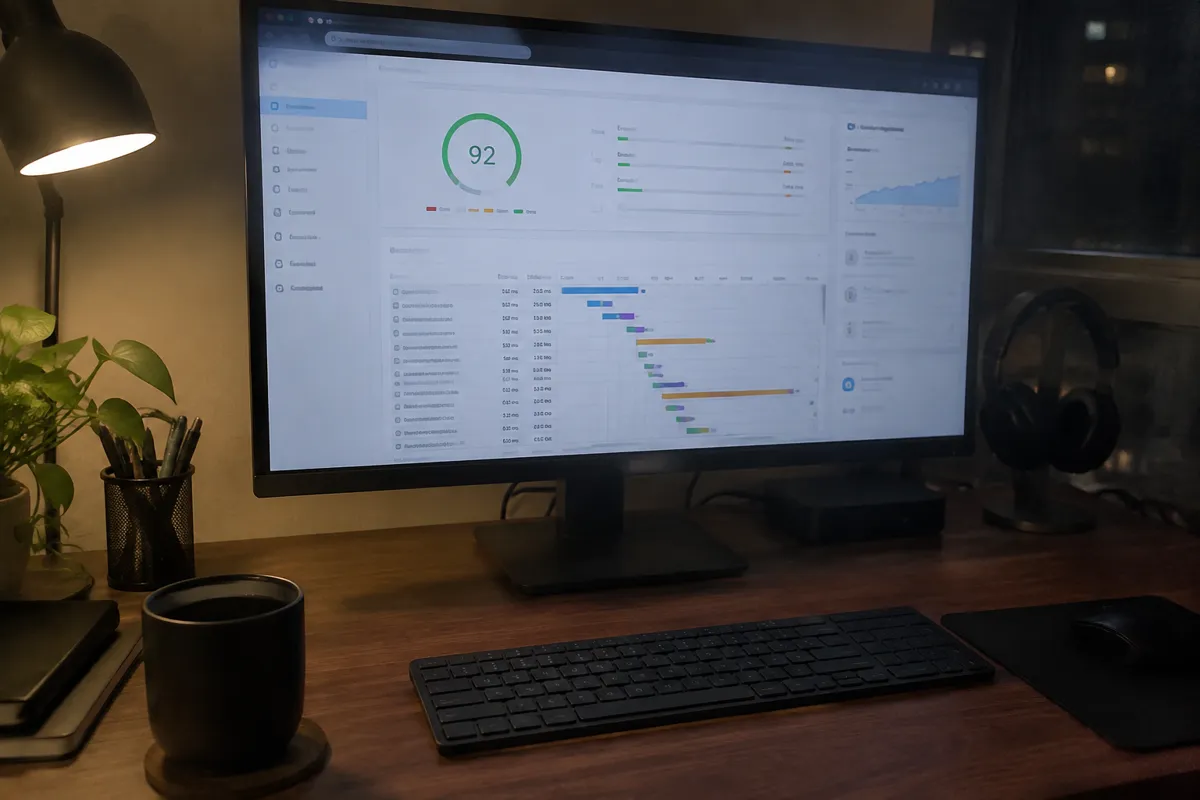
Use Google PageSpeed Insights or the Chrome UX Report for real-world field data on Core Web Vitals. Use a tool like WebPageTest for a detailed waterfall breakdown of exactly where time is spent on a specific page load. Server-side response time can be measured directly with curl -w timing output or a host’s built-in performance monitoring, if available.

App-Side vs Hosting-Side: Knowing Which Fix to Reach For
A recurring mistake is applying the wrong category of fix to a given symptom. If a page is slow on first load for every visitor regardless of caching, that’s almost always a hosting-side or database problem. No amount of image compression fixes a server that takes 900ms just to start responding. Conversely, if TTFB is already fast but the page still feels sluggish once it starts loading, the bottleneck has usually moved to the front end. Oversized images, render-blocking scripts, or excessive third-party tags — analytics, chat widgets, ad scripts — each add their own delay independent of the server.
A practical rule: diagnose with a waterfall tool before applying any fix. If the “Waiting” (TTFB) portion of the waterfall dominates the timeline, look at hosting and database layers first. If the waterfall shows a fast initial response but a long tail of asset downloads and script execution afterward, the front end is where the time is actually going instead.
Additional Fixes Worth Checking
- PHP version — an outdated PHP version can measurably slow a dynamic site independent of hosting quality. See PHP version and website performance.
- CDN setup — if not already in place, this is often the highest-leverage single change available. See how to set up a CDN.
- Hosting tier — a high-traffic site outgrowing shared hosting resource limits will show speed symptoms no amount of caching fixes. See best hosting for high-traffic websites and consider whether NVMe storage is part of the current plan.
How to Speed Up a Website FAQ
What’s the single fastest way to speed up a slow website? Adding a CDN and enabling page-level caching typically produces the largest, fastest-to-implement improvement. It removes repeated server work entirely rather than optimizing it.
Is hosting or code the real bottleneck for most slow sites? Usually both contribute. A high-traffic or database-heavy site frequently needs a hosting upgrade to see real gains. But even the best hosting can’t compensate for unoptimized images or inefficient queries.
How do I know which layer is actually slow? Use a waterfall tool like WebPageTest. It breaks a page load down by exactly where time is spent — server response, asset download, rendering. That points directly at the layer that needs attention.
Do Core Web Vitals actually affect my search ranking? Yes, they’re a confirmed ranking factor, though a smaller one than content relevance and quality. They matter more as a differentiator between similarly relevant pages.
How often should I re-test site speed after making changes? After every significant change — a new plugin, a hosting upgrade, added images — rather than only during periodic audits. Speed regressions accumulate quietly otherwise.